Are we in a bubble?
The data says yes, and it isn't subtle.
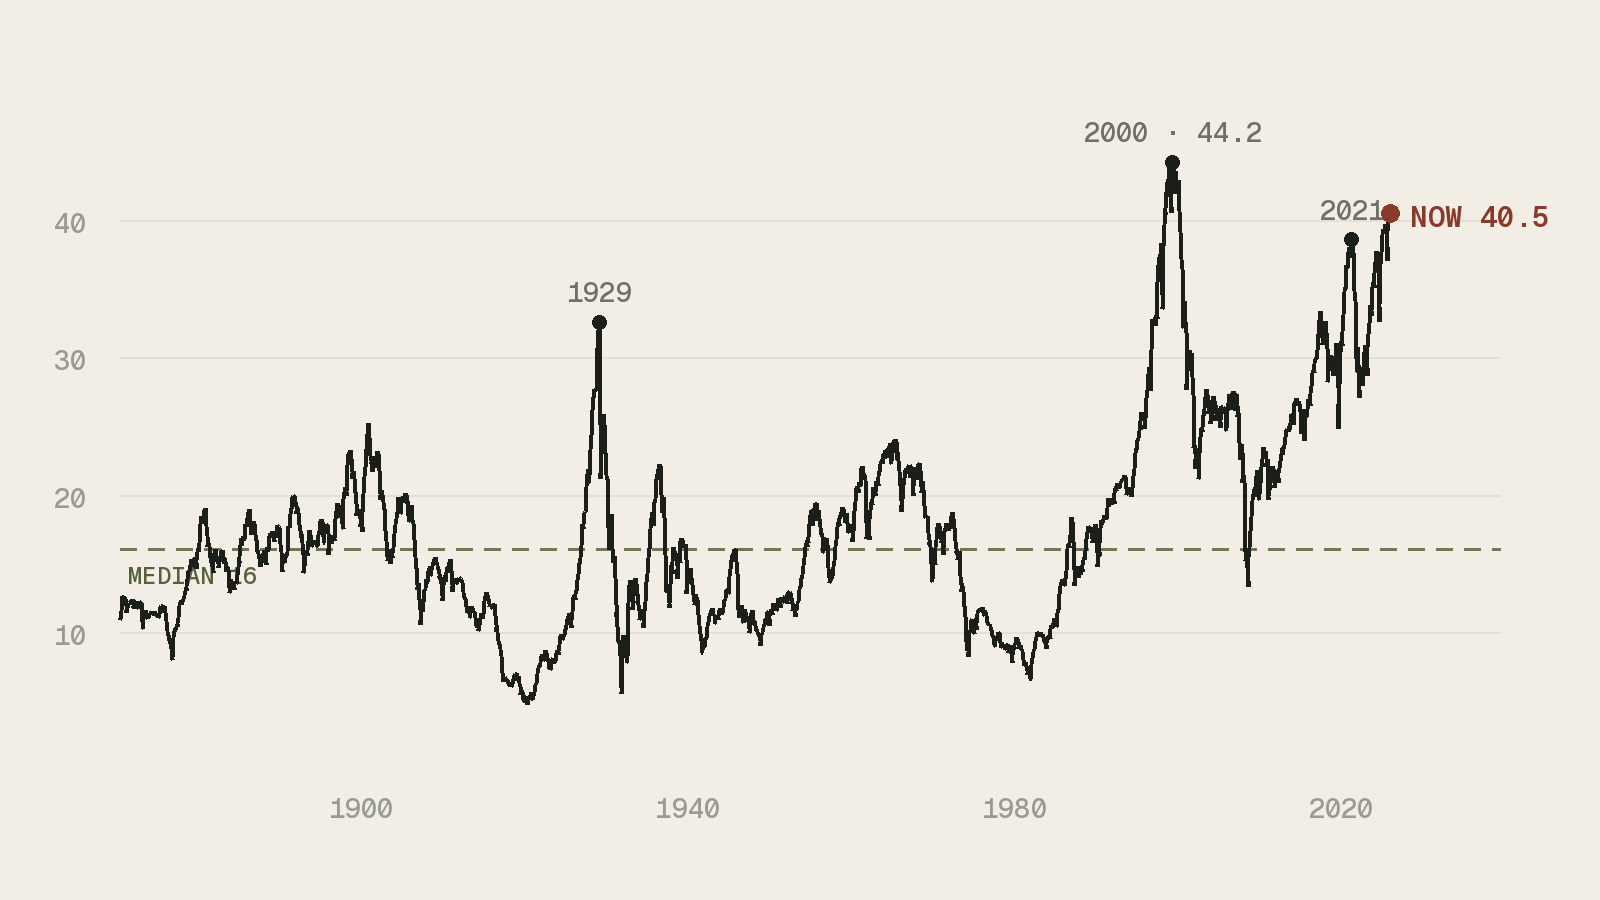
Let's start with the price. The Shiller CAPE, which measures the market against ten years of real earnings, sits at 40.5. The second highest reading in 145 years. Warren Buffett's preferred gauge, the value of the entire market against the size of the economy, reads 219 per cent. The dot-com peak was 140. We are not near the most famous bubble in living memory. We are past it. There's a free scorecard that tracks all of this point-in-time, replayed at every past peak (thetrading.tools/bubble-tracker). It read 2 out of 10 at the 2007 top, because 2008 was a credit bubble, not a price bubble. Today it reads 8 out of 10.
Then the concentration. Scott Galloway has been banging this drum for a year and the numbers back him. Ten companies now make up 40 per cent of the S&P 500. Since ChatGPT launched, AI-related stocks have delivered 75 per cent of the index's returns, 80 per cent of its earnings growth and 90 per cent of its capital spending growth. AI investment accounts for roughly 92 per cent of US GDP growth this year. Strip it out and the economy is flat. An index fund used to mean owning a little of everything. It now means owning one bet.
Then the debt, which is where it gets properly 2007. The story says this buildout is funded from earnings, and the headline balance sheets agree. The balance sheets are the trick. Oracle, Meta, xAI and CoreWeave have moved more than 120 billion dollars of data centre debt into special purpose vehicles designed to keep it off their books. Meta financed one Louisiana campus through a vehicle that borrowed 27 billion from Pimco, BlackRock and Apollo. None of it sits on Meta's balance sheet, which is partly how Meta raised another 30 billion in bonds weeks later. Oracle leases its OpenAI facilities back from vehicles carrying tens of billions more, and its credit default swaps have tripled since September. Private credit lending to AI has gone from near zero to past 200 billion dollars, with 800 billion more projected. In 2006 the leverage hid in SIVs and CDOs, off the bank balance sheets, invisible to the gauges. Now it hides in SPVs and private credit, off the corporate balance sheets, invisible to the same gauges.
And in January the structure showed its finished form. A fund tied to Elon Musk's ecosystem raised 5.4 billion dollars, bought thousands of Nvidia's newest chips, and leased them to xAI. Nvidia booked the full 5.4 billion as revenue immediately. Nvidia had also put 1.9 billion of its own money into the vehicle doing the buying. The seller helped fund its own sale. The revenue looks organic on the income statement, the demand looks real, and the debt lives in a vehicle that nobody's balance sheet claims. Follow the risk down the chain and it lands with an insurance affiliate selling annuities to retirees, holding over 100 billion dollars in assets priced by its own internal models. Michael Burry, the investor who saw 2008 coming, has a word for this structure. Fugazi. His comparison isn't Enron, because none of this is illegal and all of it is disclosed, in footnotes. His comparison is Cisco in 1999. A real company, selling real equipment, into demand partly made of its own money.
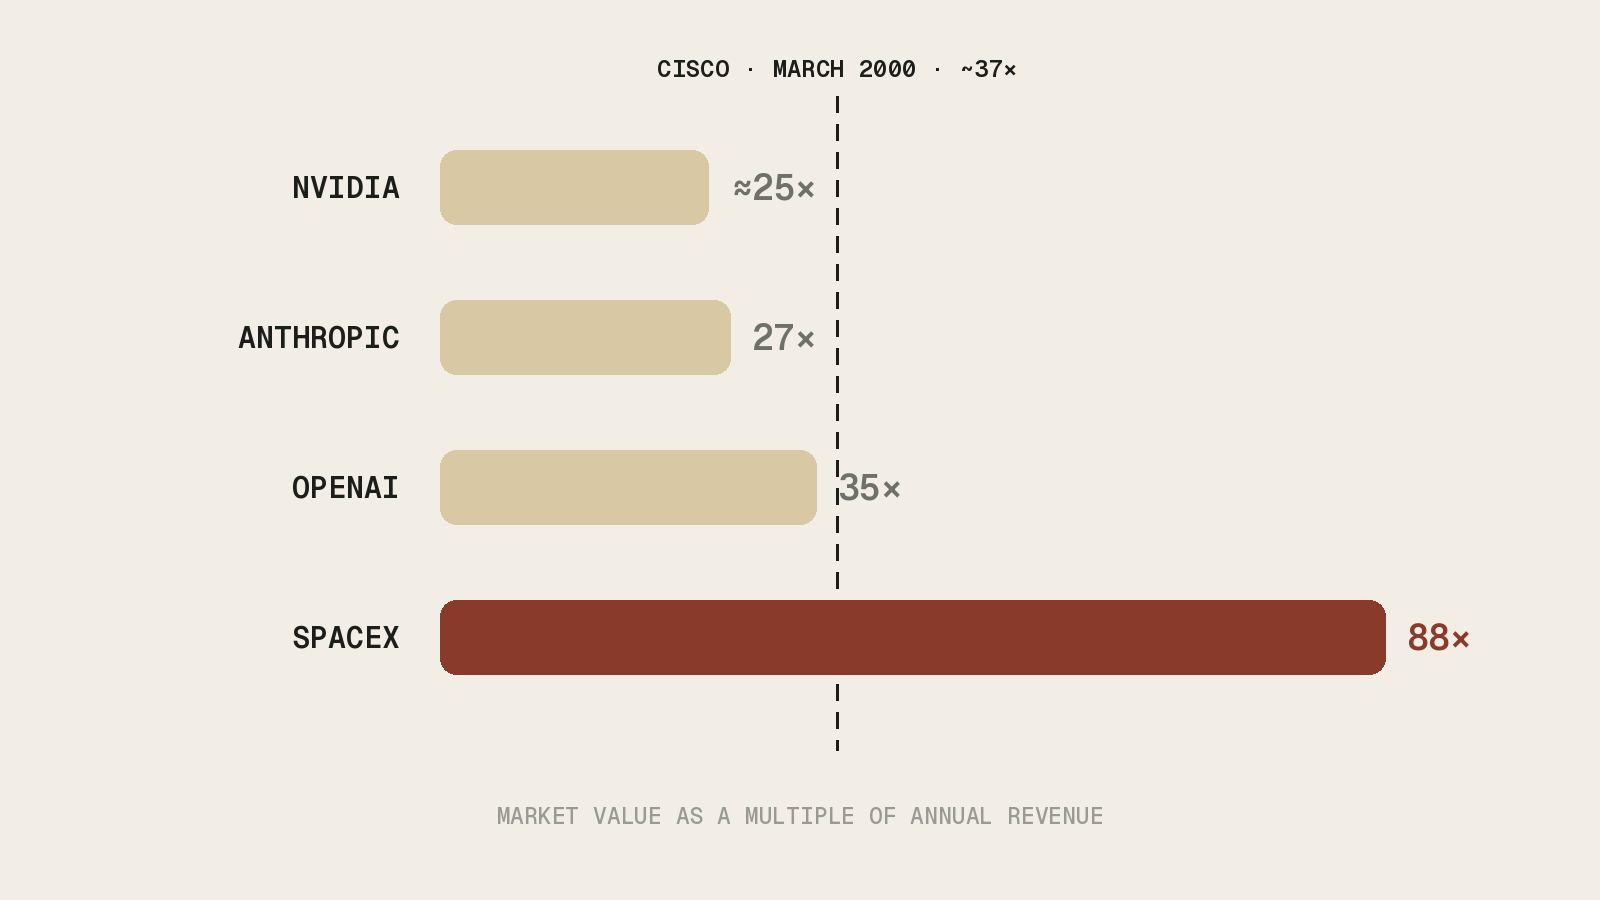
Price is extreme. Concentration is extreme. Leverage is hidden. And some of the earnings are the companies buying from themselves. That's the yes.
But here's the problem with every one of those gauges. None of them has ever timed anything. The scorecard read maximum in December 1997 and the Nasdaq tripled afterwards. Price gives you the what, but not the when.
For that, you need an industry that has already run the experiment.
The instrument
Strictly speaking, music is not the first industry new technology reaches. That title belongs to the adult industry. It decided the VHS format war. It built the early internet's payment rails. It meets every technology (see VR) before anyone else and publishes nothing.
Music arrives almost as early and writes everything down. Streams are counted. Royalties are reported. Every catalogue sale has a price.
Alan Krueger made this the premise of a book. He was an economist who ran the numbers for a president, chairman of the Council of Economic Advisers, and he spent his final years backstage interviewing musicians, promoters and managers. His argument in Rockonomics was simple. Music meets each wave of technology among the first, so what happens to musicians happens to the rest of us later. Napster gutted recorded music before the internet gutted newspapers. Streaming rebuilt music as a subscription before subscriptions rebuilt software. Playlist algorithms decided what got heard before feed algorithms decided what got seen. He died in early 2019, months before the book was published. It reads differently now. Less like an economics text. More like a warning that arrived early.
The link isn't a metaphor either. A Journal of Financial Economics study measured the emotional positivity of the songs forty countries streamed on Spotify and found each country's stock market moved with its music the same week, then gave the gain back the next. And music has even front-run the credit cycle before. Cheap money bid song catalogues from 12 times earnings to 29 at the 2021 peak. Rates rose, the biggest fund, Hipgnosis, collapsed, Blackstone bought it at a discount. Music's debt bubble popped in 2023, two years before anyone thought to stress-test the AI trade.
What the receipts say
Here is what the music industry looks like right now, and next to each number, its twin in the wider economy.
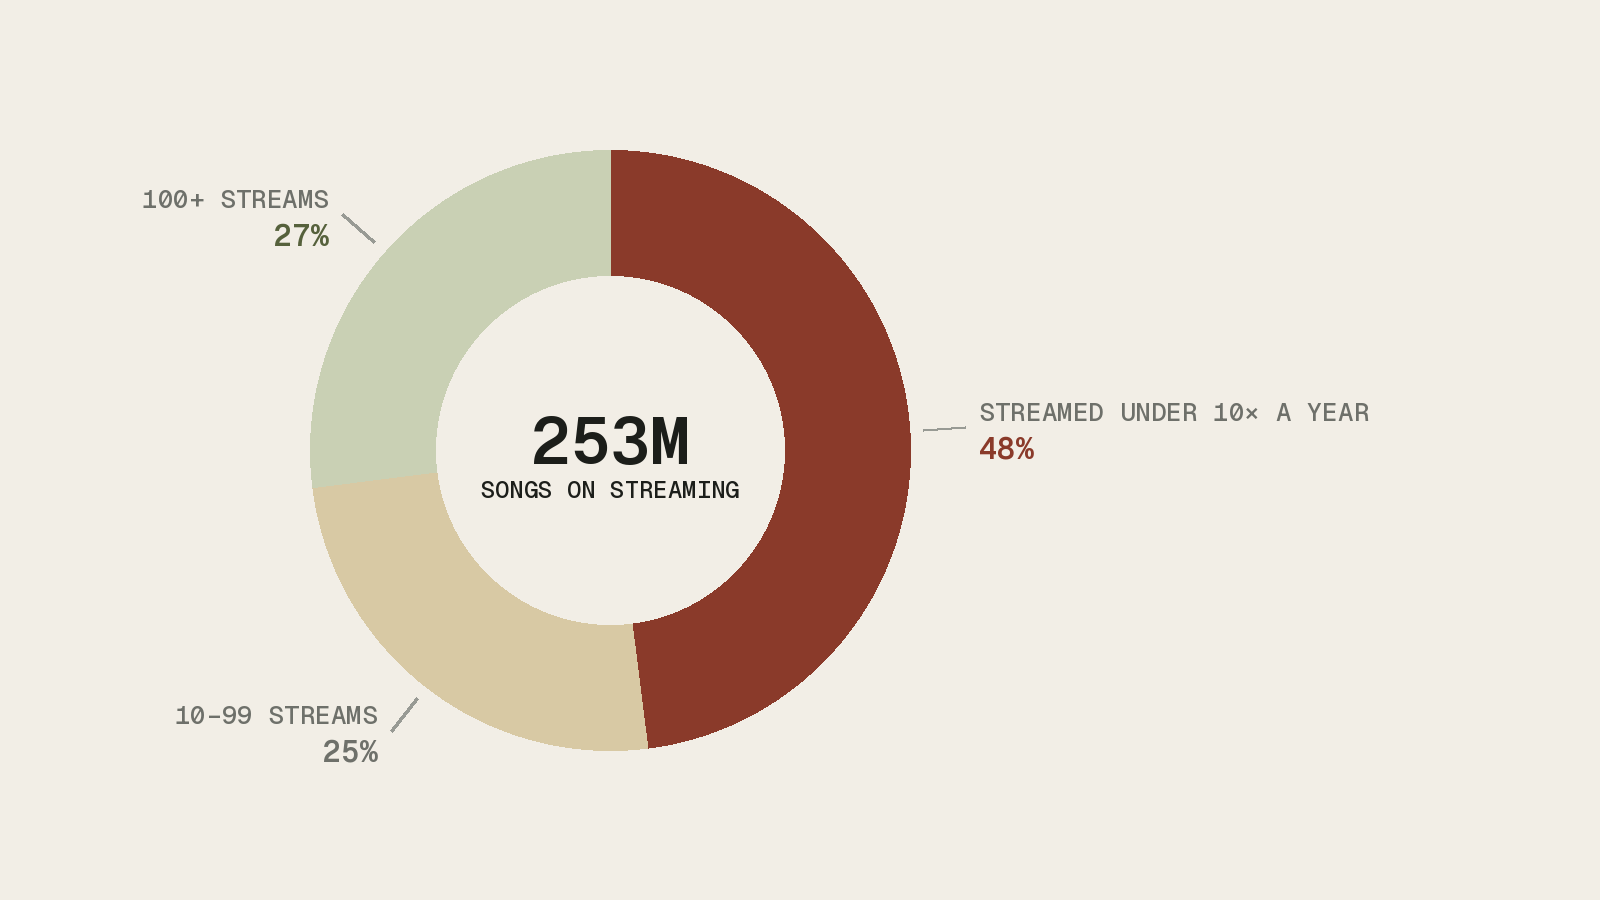
The flood. There were 253 million tracks on streaming services at the end of 2025, growing by 106,000 uploads a day. The industry twin is the capex line. Five companies alone will spend roughly 739 billion dollars on AI capacity this year, up 78 per cent in twelve months. Both are the same event. Supply arriving faster than anyone asked for it.
The silence. Almost half of those 253 million tracks were played fewer than ten times all year. Nearly three quarters didn't reach a hundred plays. Supply without demand is not a market. It's inventory. Hold that next to the data centres being financed on fifteen-year leases before the customers exist.
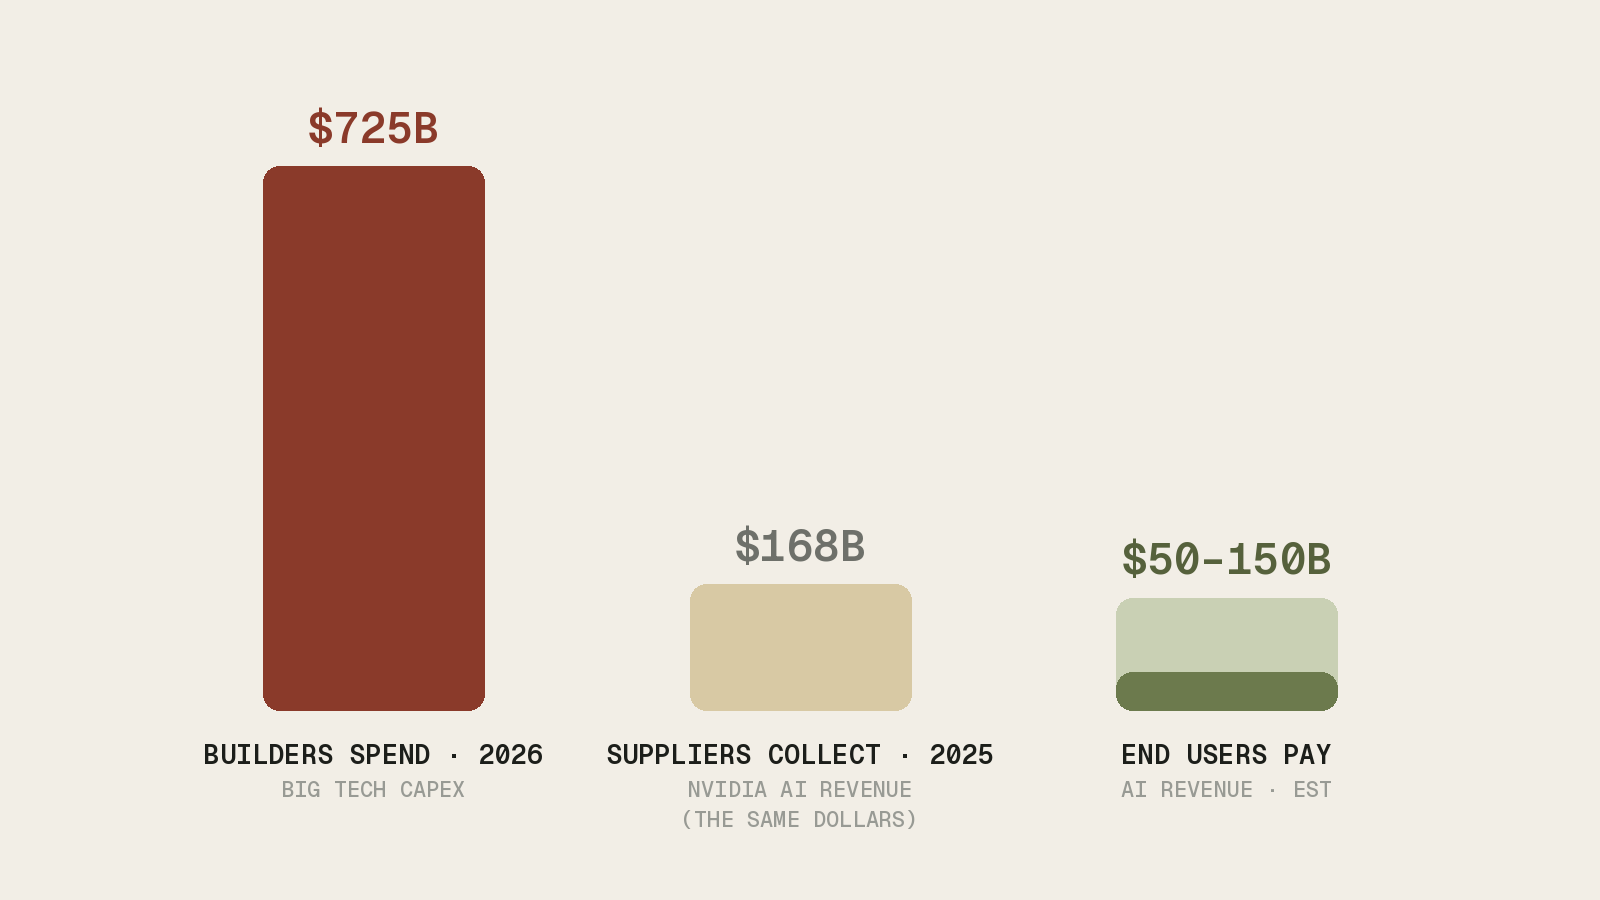
The machines. In January 2025, one in ten new tracks uploaded to Deezer was fully AI-generated. By June this year it passed half. Ninety thousand machine-made songs a day, on one platform. And the listening? Between one and three per cent of streams, of which 85 per cent were flagged as fraud. Machines uploading songs for machines to stream. Apple Music reports the same shape, a third of new uploads, less than half of one per cent of listening. This is the cleanest data on earth about what happens when AI supply meets human demand. Supply went vertical. Demand never moved. Generation is cheap. Attention is not. The wider economy is spending 739 billion dollars this year to ask a question music has already answered.
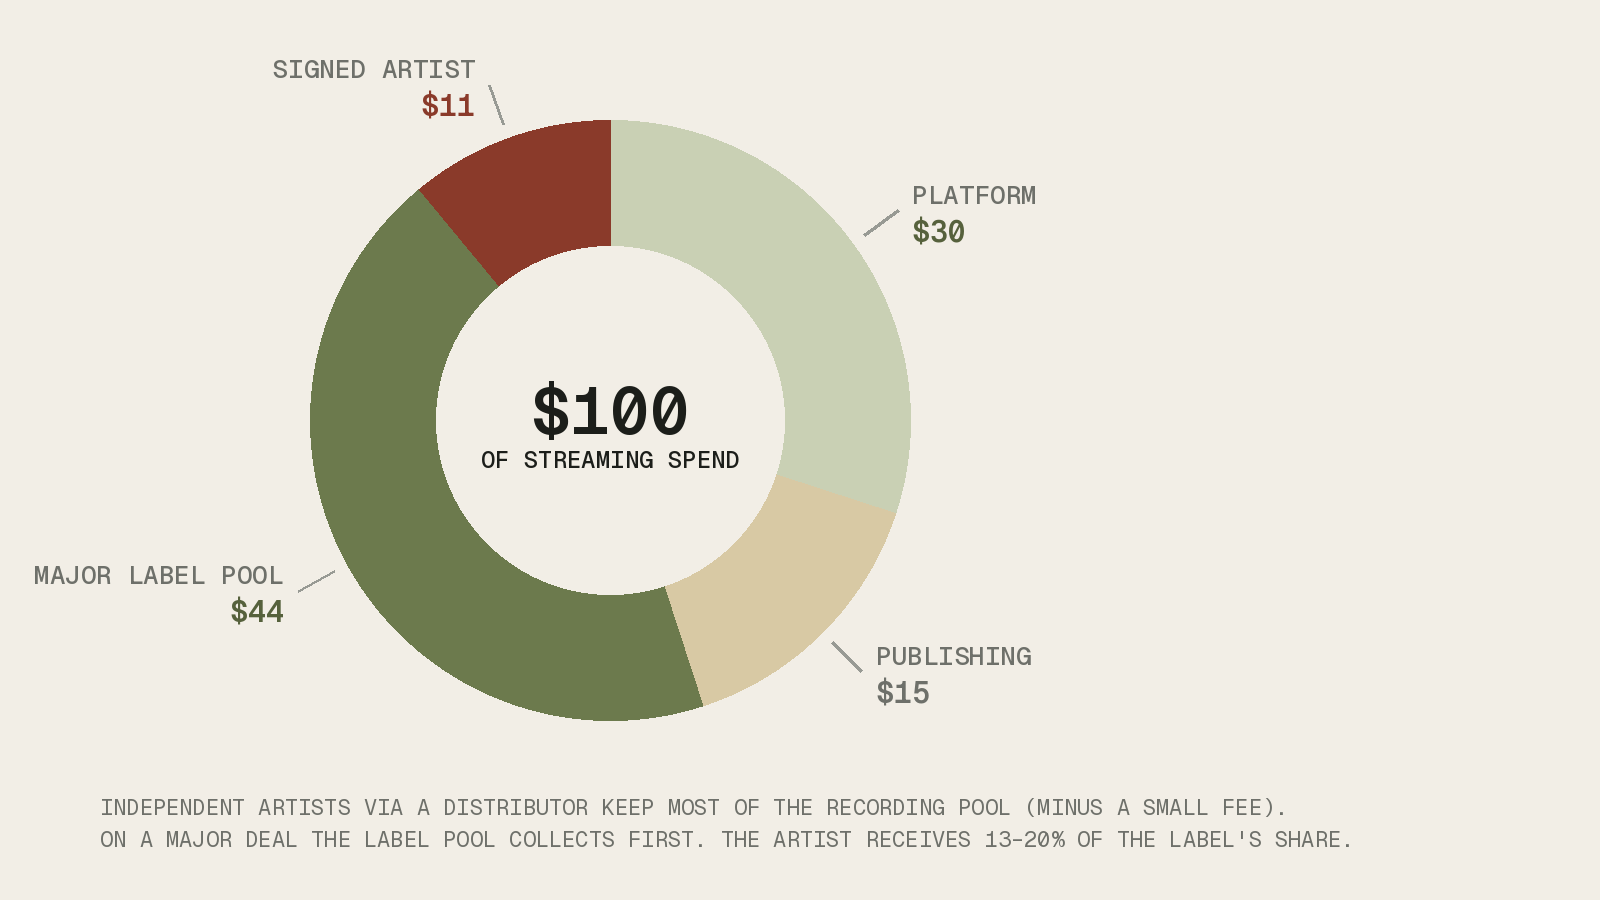
The split. Global recorded music brought in 31.7 billion dollars in 2025, its eleventh straight year of growth. Streaming platforms keep roughly 30 per cent off the top. Three major labels control around two thirds of what remains. And the artist who made the song? On a major label deal, their share of the streaming royalty runs between 13 and 20 per cent of the label's cut. Follow a single dollar down the chain and the person who created the thing keeps something close to a tenth. The industry twin writes itself. In the AI economy, the platforms and the compute owners are the labels. The concentration of the S&P 500 is the same chart as the concentration of streaming payouts. The S&P 500 didn't become a bubble. It became Spotify.
What the instrument is for
None of this times a top. Music can't tell you the month, and neither can anything else. What it gives you is a measuring instrument that runs five to ten years ahead of the economy and publishes its results.
Read the instrument today and it says three things. Supply is not demand, however cheap supply becomes. Value concentrates with whoever owns distribution, not with whoever creates. And when the flood arrives, the money migrates to what the flood can't touch. In music that meant the stage, the scarce, the verified. It will mean the same everywhere else.
That's the method. When you want to know what a technology does to an economy, don't ask the people selling it.
My prediction
I'll close with where I land, because two things can be true at once.
There is a bubble. And the technology is real. It will survive the correction and it will change how we work, the way the internet survived 2000 and changed everything after. Those aren't competing claims. They're the same pattern. The railways went bankrupt and the tracks carried a century of trade. The telecoms collapsed in 2001 and their dark fibre carried the internet you're reading this on.
Which means a great deal of the money being spent right now is going into things that won't survive the next ten years. Chips that depreciate in four years, financed on leases that run fifteen, some of them sold into demand the sellers themselves financed. Capacity built for customers who don't exist yet, and may not. It reminds me of the photographs of Chinese ghost cities. Entire districts built for a million people, towers finished, streets lit, standing empty for a decade. Some of them eventually filled. The money that built them was mostly gone by then.
The buildout will remain. The tracks, the fibre, the data centres. A lot of the companies won't, and a lot of the capital won't either. Which comes at a cost.
The music industry already knows how this goes. The question is whether anyone's listening.
Sources
- thetrading.tools Bubble Tracker. Point-in-time scorecard, 2/10 at the 2007 peak, 8/10 today, 10/10 in 2000. multpl.com (Shiller CAPE 40.5, Jul 2026). CurrentMarketValuation.com (Buffett Indicator 219%).
- Scott Galloway, "How Does the End Begin?" (Oct 2025) and The Diary of a CEO (2026). Ten stocks at 40% of the S&P; AI stocks at 75% of returns, 80% of earnings growth, 90% of capex growth since ChatGPT; AI at ~92% of US GDP growth (citing Jason Furman).
- Financial Times via industry reports (Dec 2025). $120B+ of AI data-centre debt in SPVs across Oracle, Meta, xAI, CoreWeave. Meta Hyperion SPV, ~$27B from Pimco, BlackRock, Apollo, followed by a $30B bond raise.
- Quinn Emanuel client alert (Mar 2026), citing Morgan Stanley. Private credit AI lending from near zero past $200B, $800B more projected.
- MUFG (Dec 2025). Oracle 5-yr CDS tripled since September.
- 24/7 Wall St via Yahoo Finance (Jun 2026), reporting Michael Burry's Cassandra Unchained. Valor Compute Infrastructure, $5.4B GPU purchase leased to xAI, Nvidia booking full revenue while anchoring ~$1.9B of SPV equity, Apollo's $3.5B debt routed via Athene, 34.7% Level 3 assets, ~16x leverage. Burry's "fugazi" and Cisco comparison.
- Alan B. Krueger, Rockonomics (2019). The leading-indicator premise.
- Edmans, Fernandez-Perez, Garel, Indriawan, "Music Sentiment and Stock Returns Around the World", Journal of Financial Economics (2022).
- Variety, Billboard (2021-2026). Catalogue multiples 12-29x, Hipgnosis collapse, Blackstone exit.
- Luminate 2025 Year-End Report via Music Business Worldwide. 253M tracks, 106K daily uploads, ~half under ten annual streams, 73% under 100.
- Deezer Newsroom (Apr and Jul 2026). AI tracks from 10% (Jan 2025) to 50%+ of daily uploads (Jun 2026), 90,000/day, 1-3% of streams, 85% of those fraudulent.
- Apple Music via TechRadar (May 2026). 33%+ of uploads AI-generated, under 0.5% of listening.
- IFPI Global Music Report 2026 via Statista. $31.7B recorded music revenue in 2025, 11th consecutive year of growth, streaming ~70%.
- Billboard Pro, Royalti.io, industry guides (2025-2026). Platform keeps ~30%; majors control ~two thirds; artist split on major deals 13-20%+ of the label share.
- Fortune / JPMorgan (Jun 2026). Hyperscaler capex $416B to est. $739B, +78%.
- Statista (Apr 2026). Big Tech capex $725B in 2026 across Meta, Microsoft, Alphabet, Amazon. BestBrokers (2026). Nvidia AI revenue $167.9B in 2025. Luminix (2026). AI-attributable end-user revenue est. $50-150B.